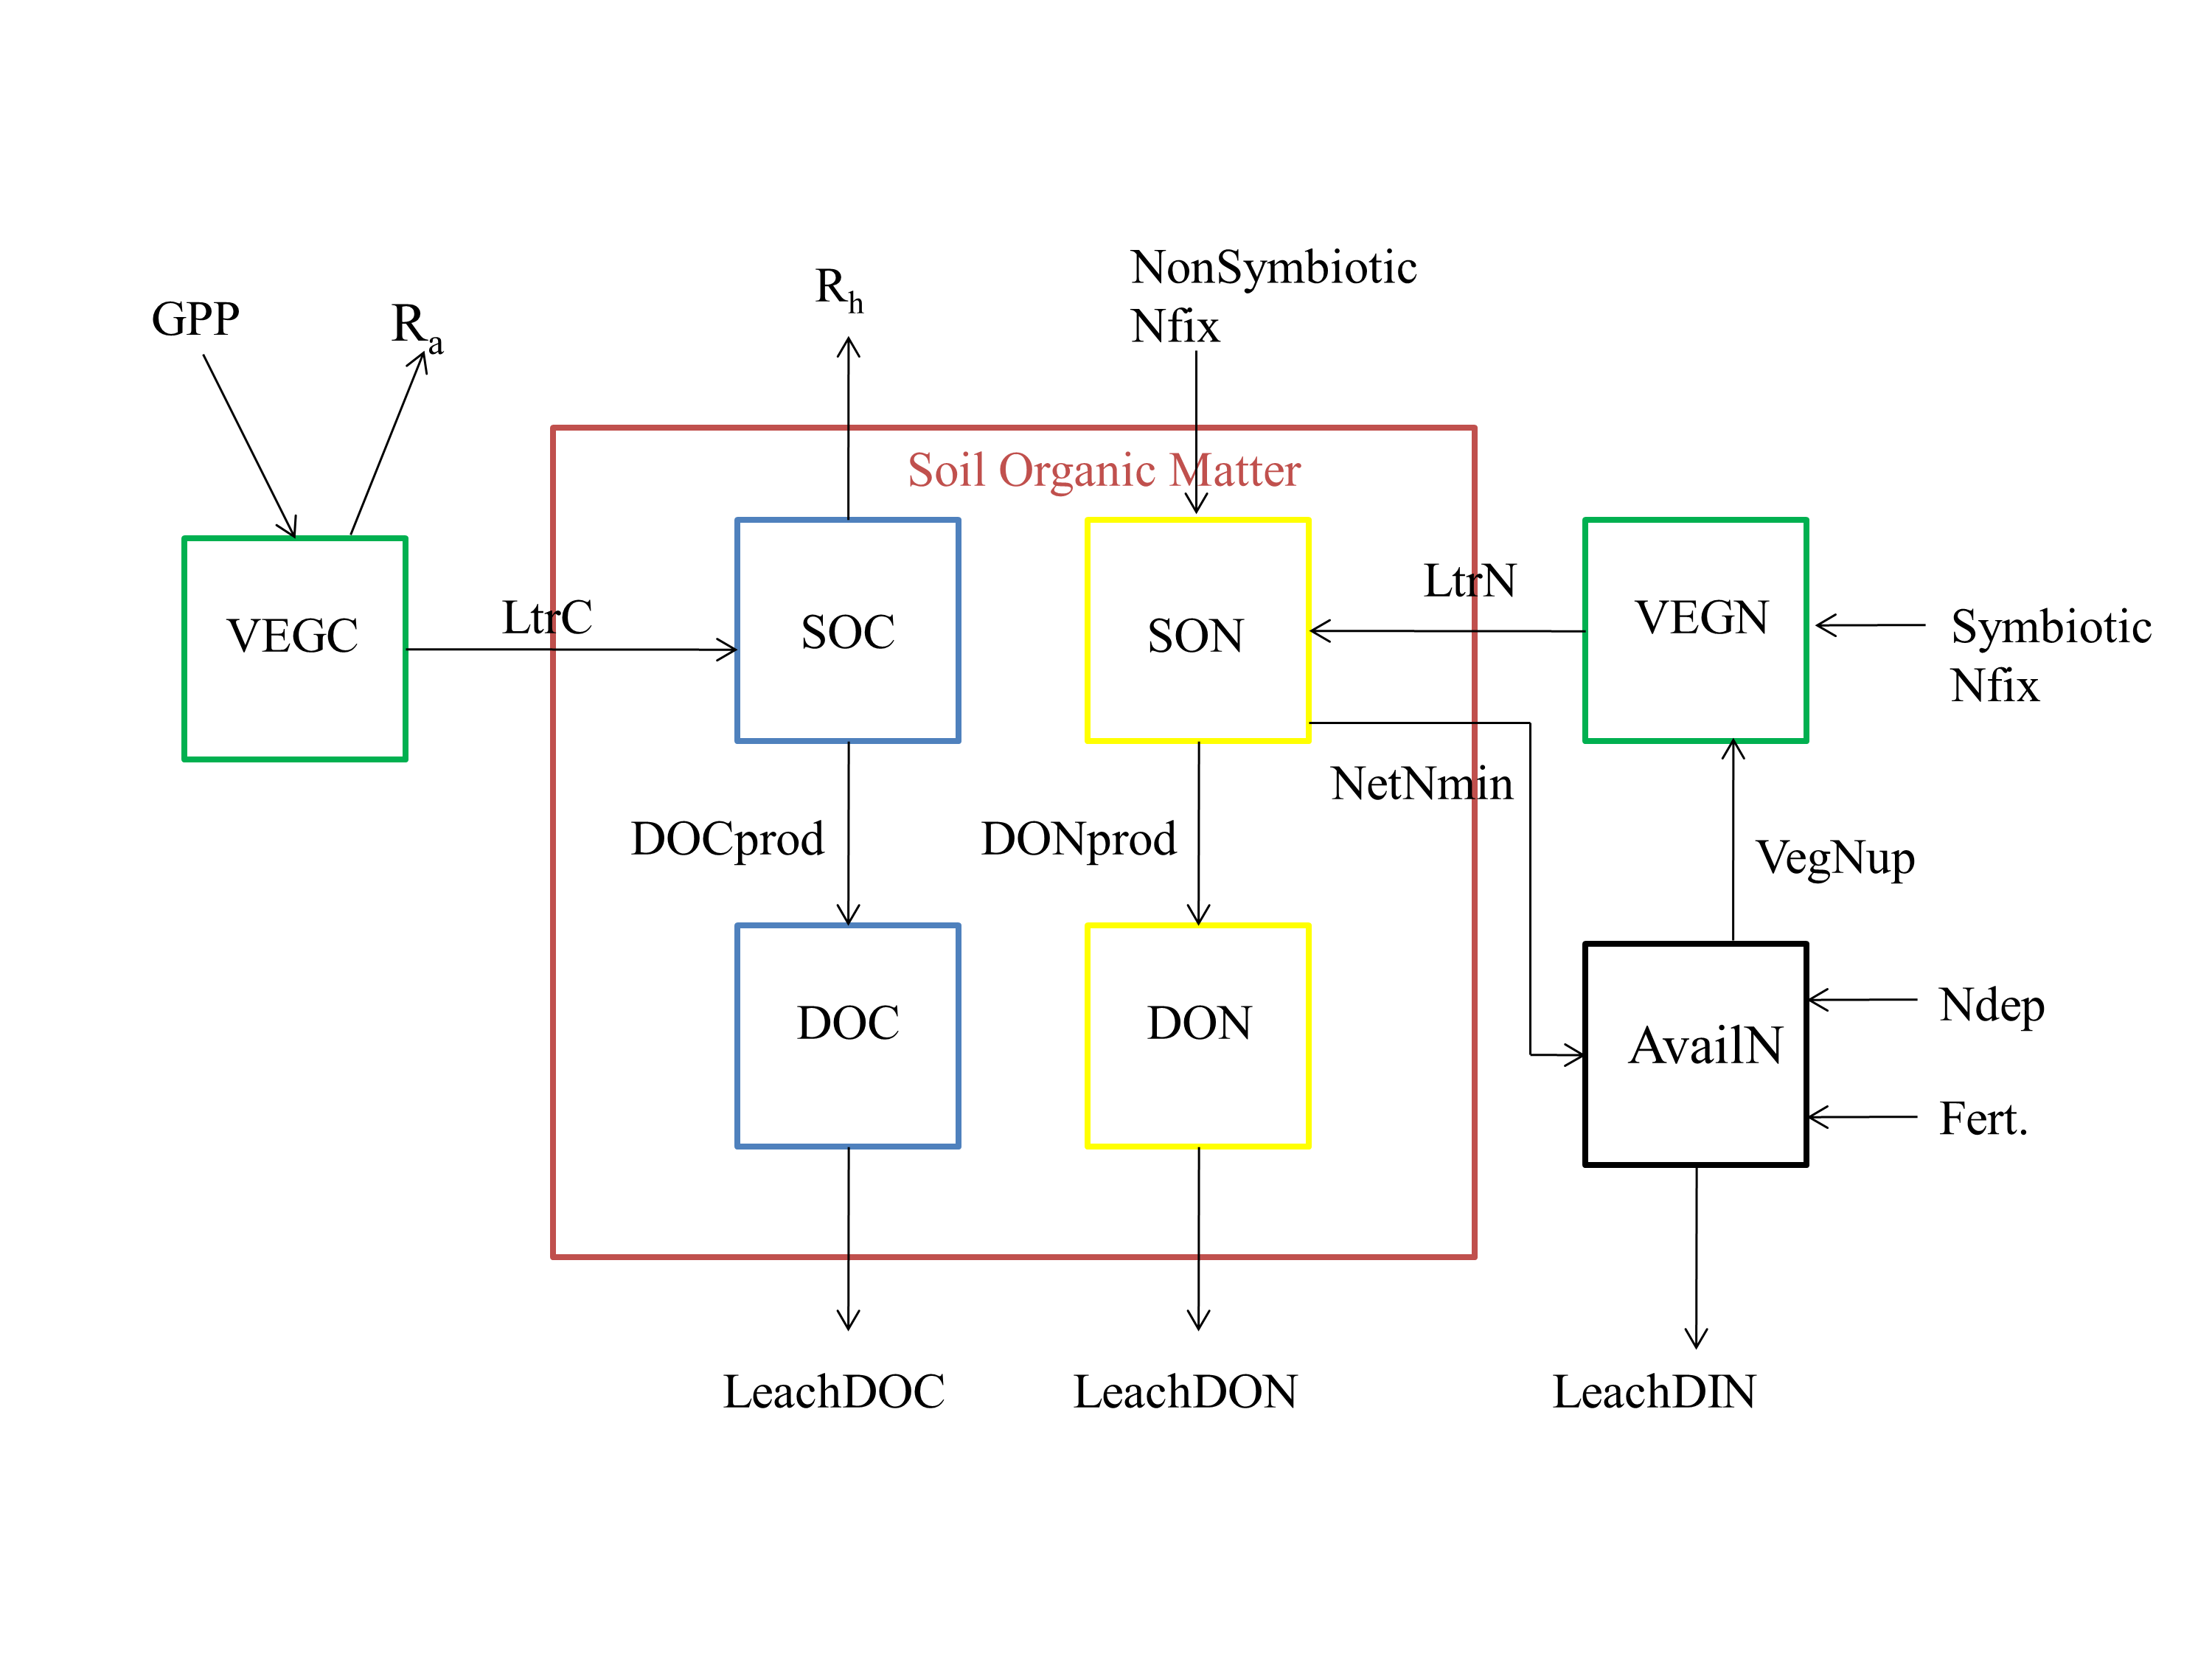
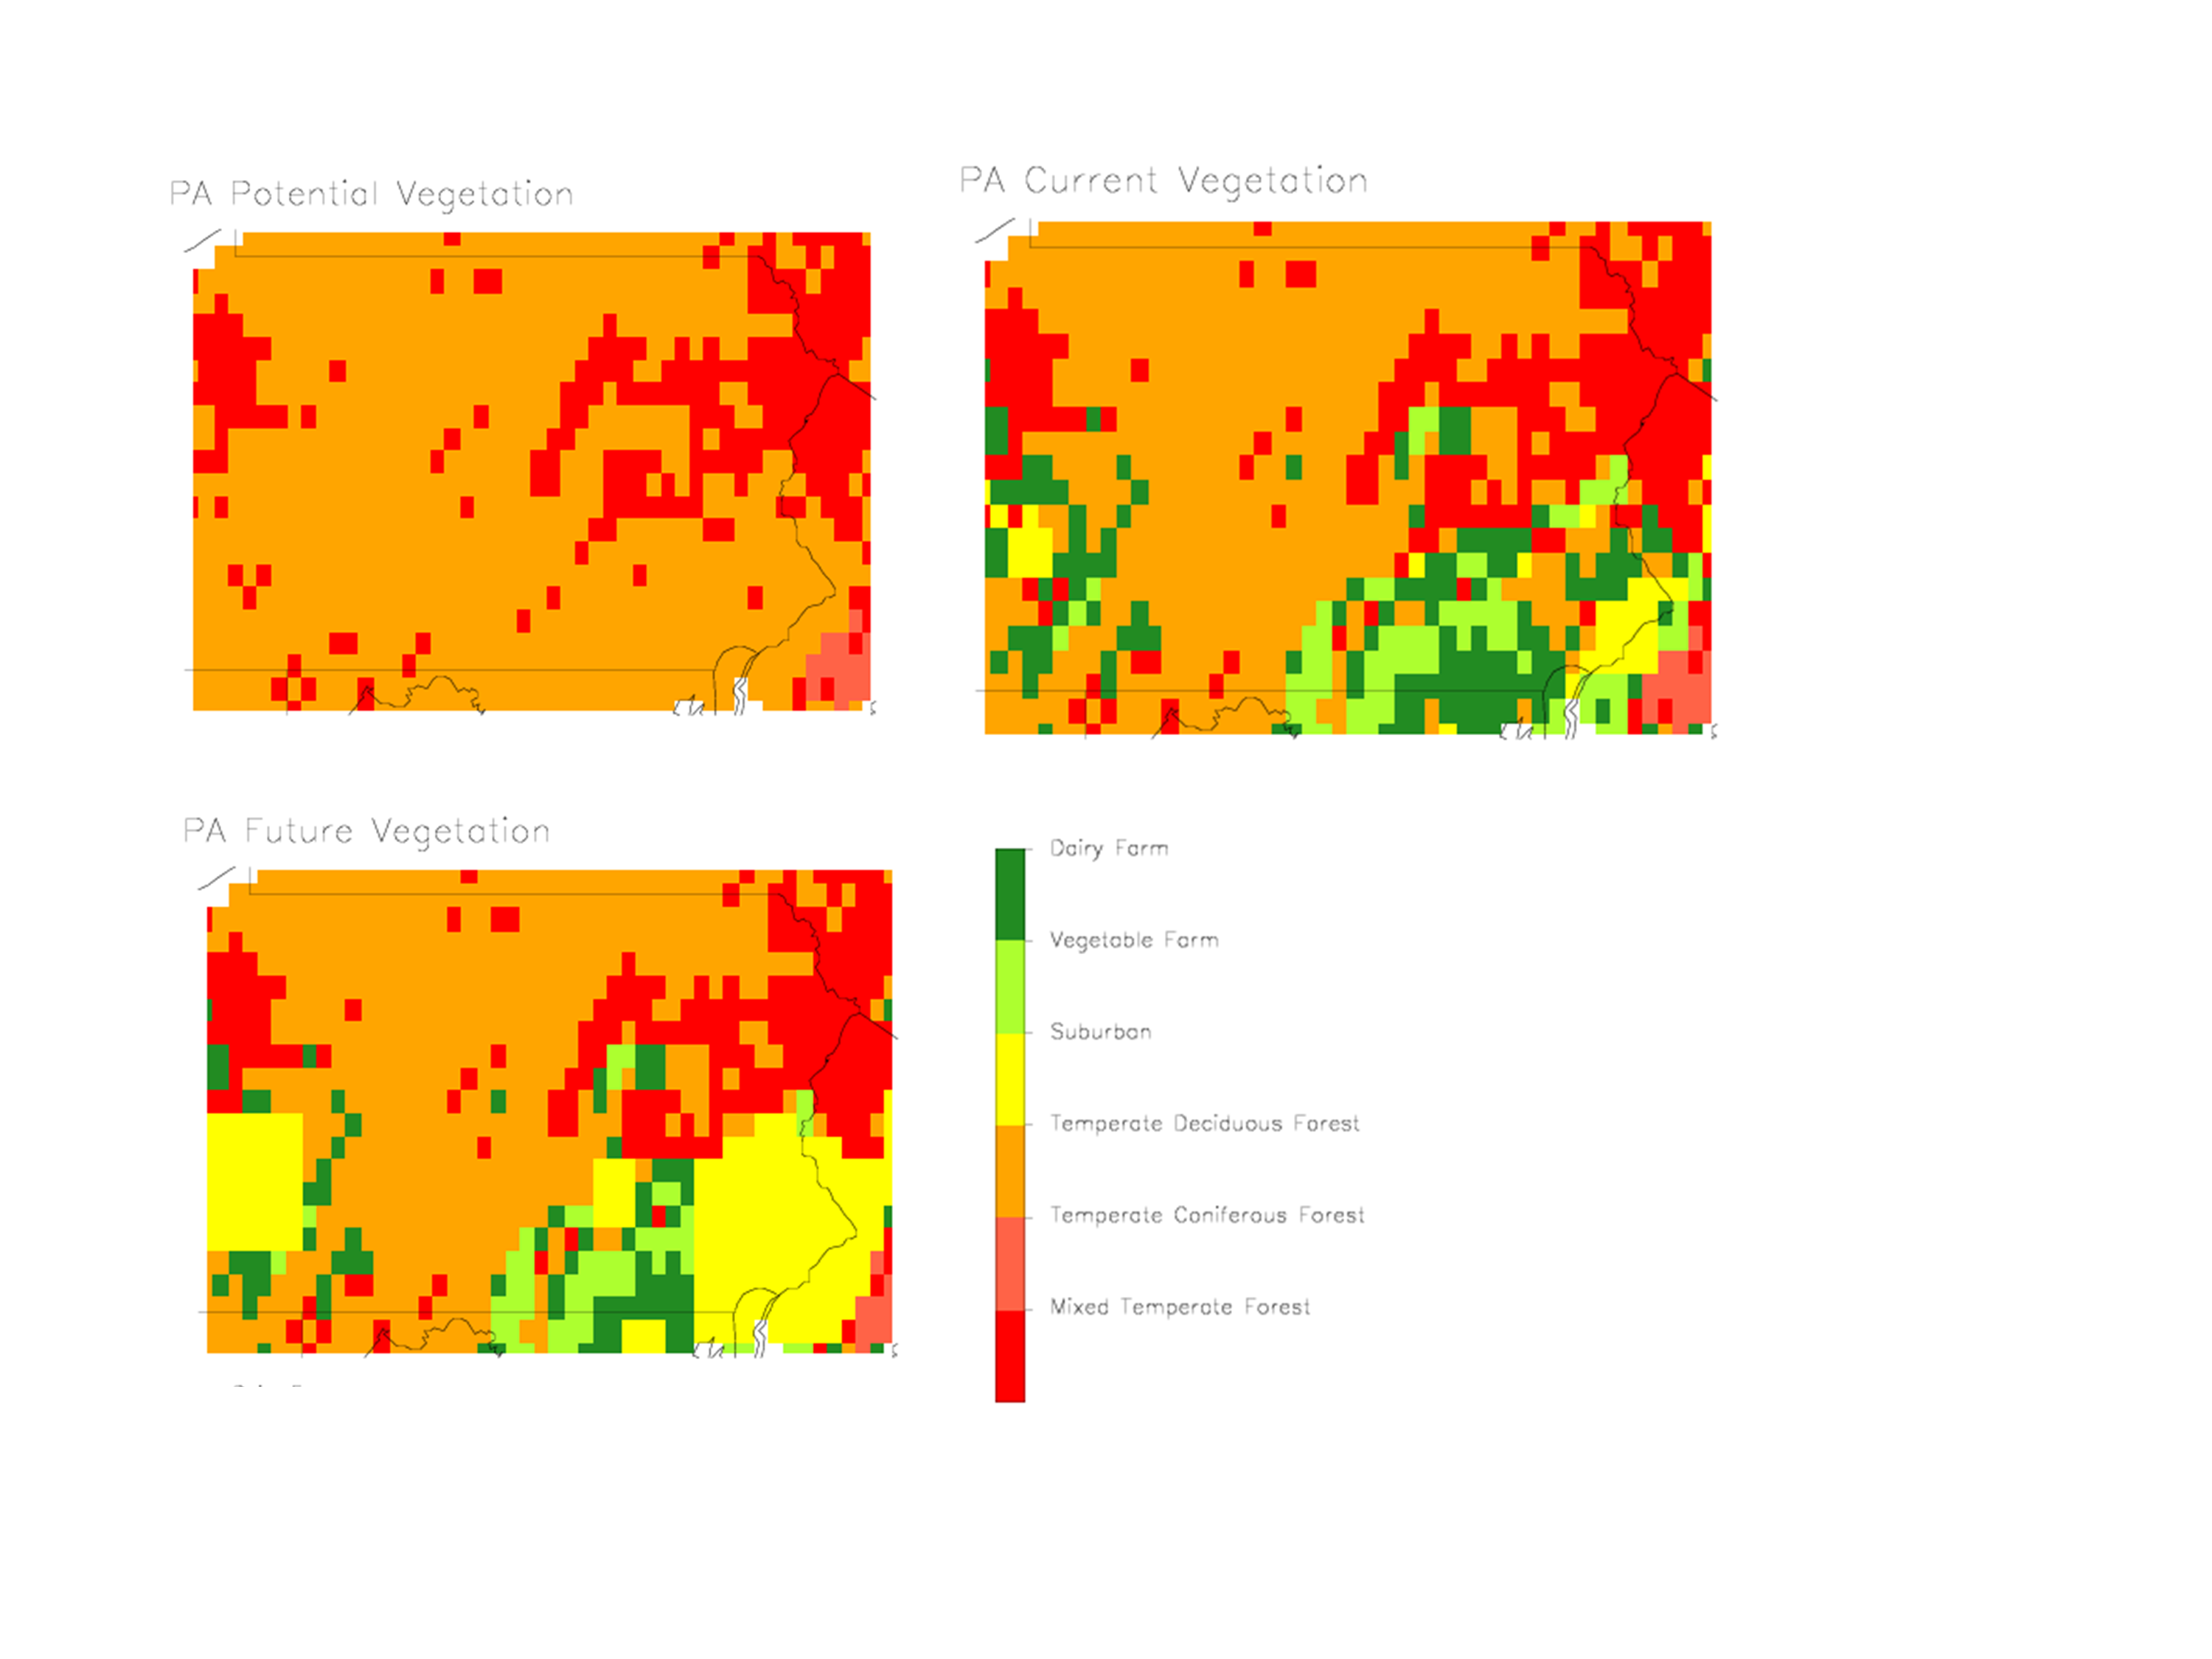
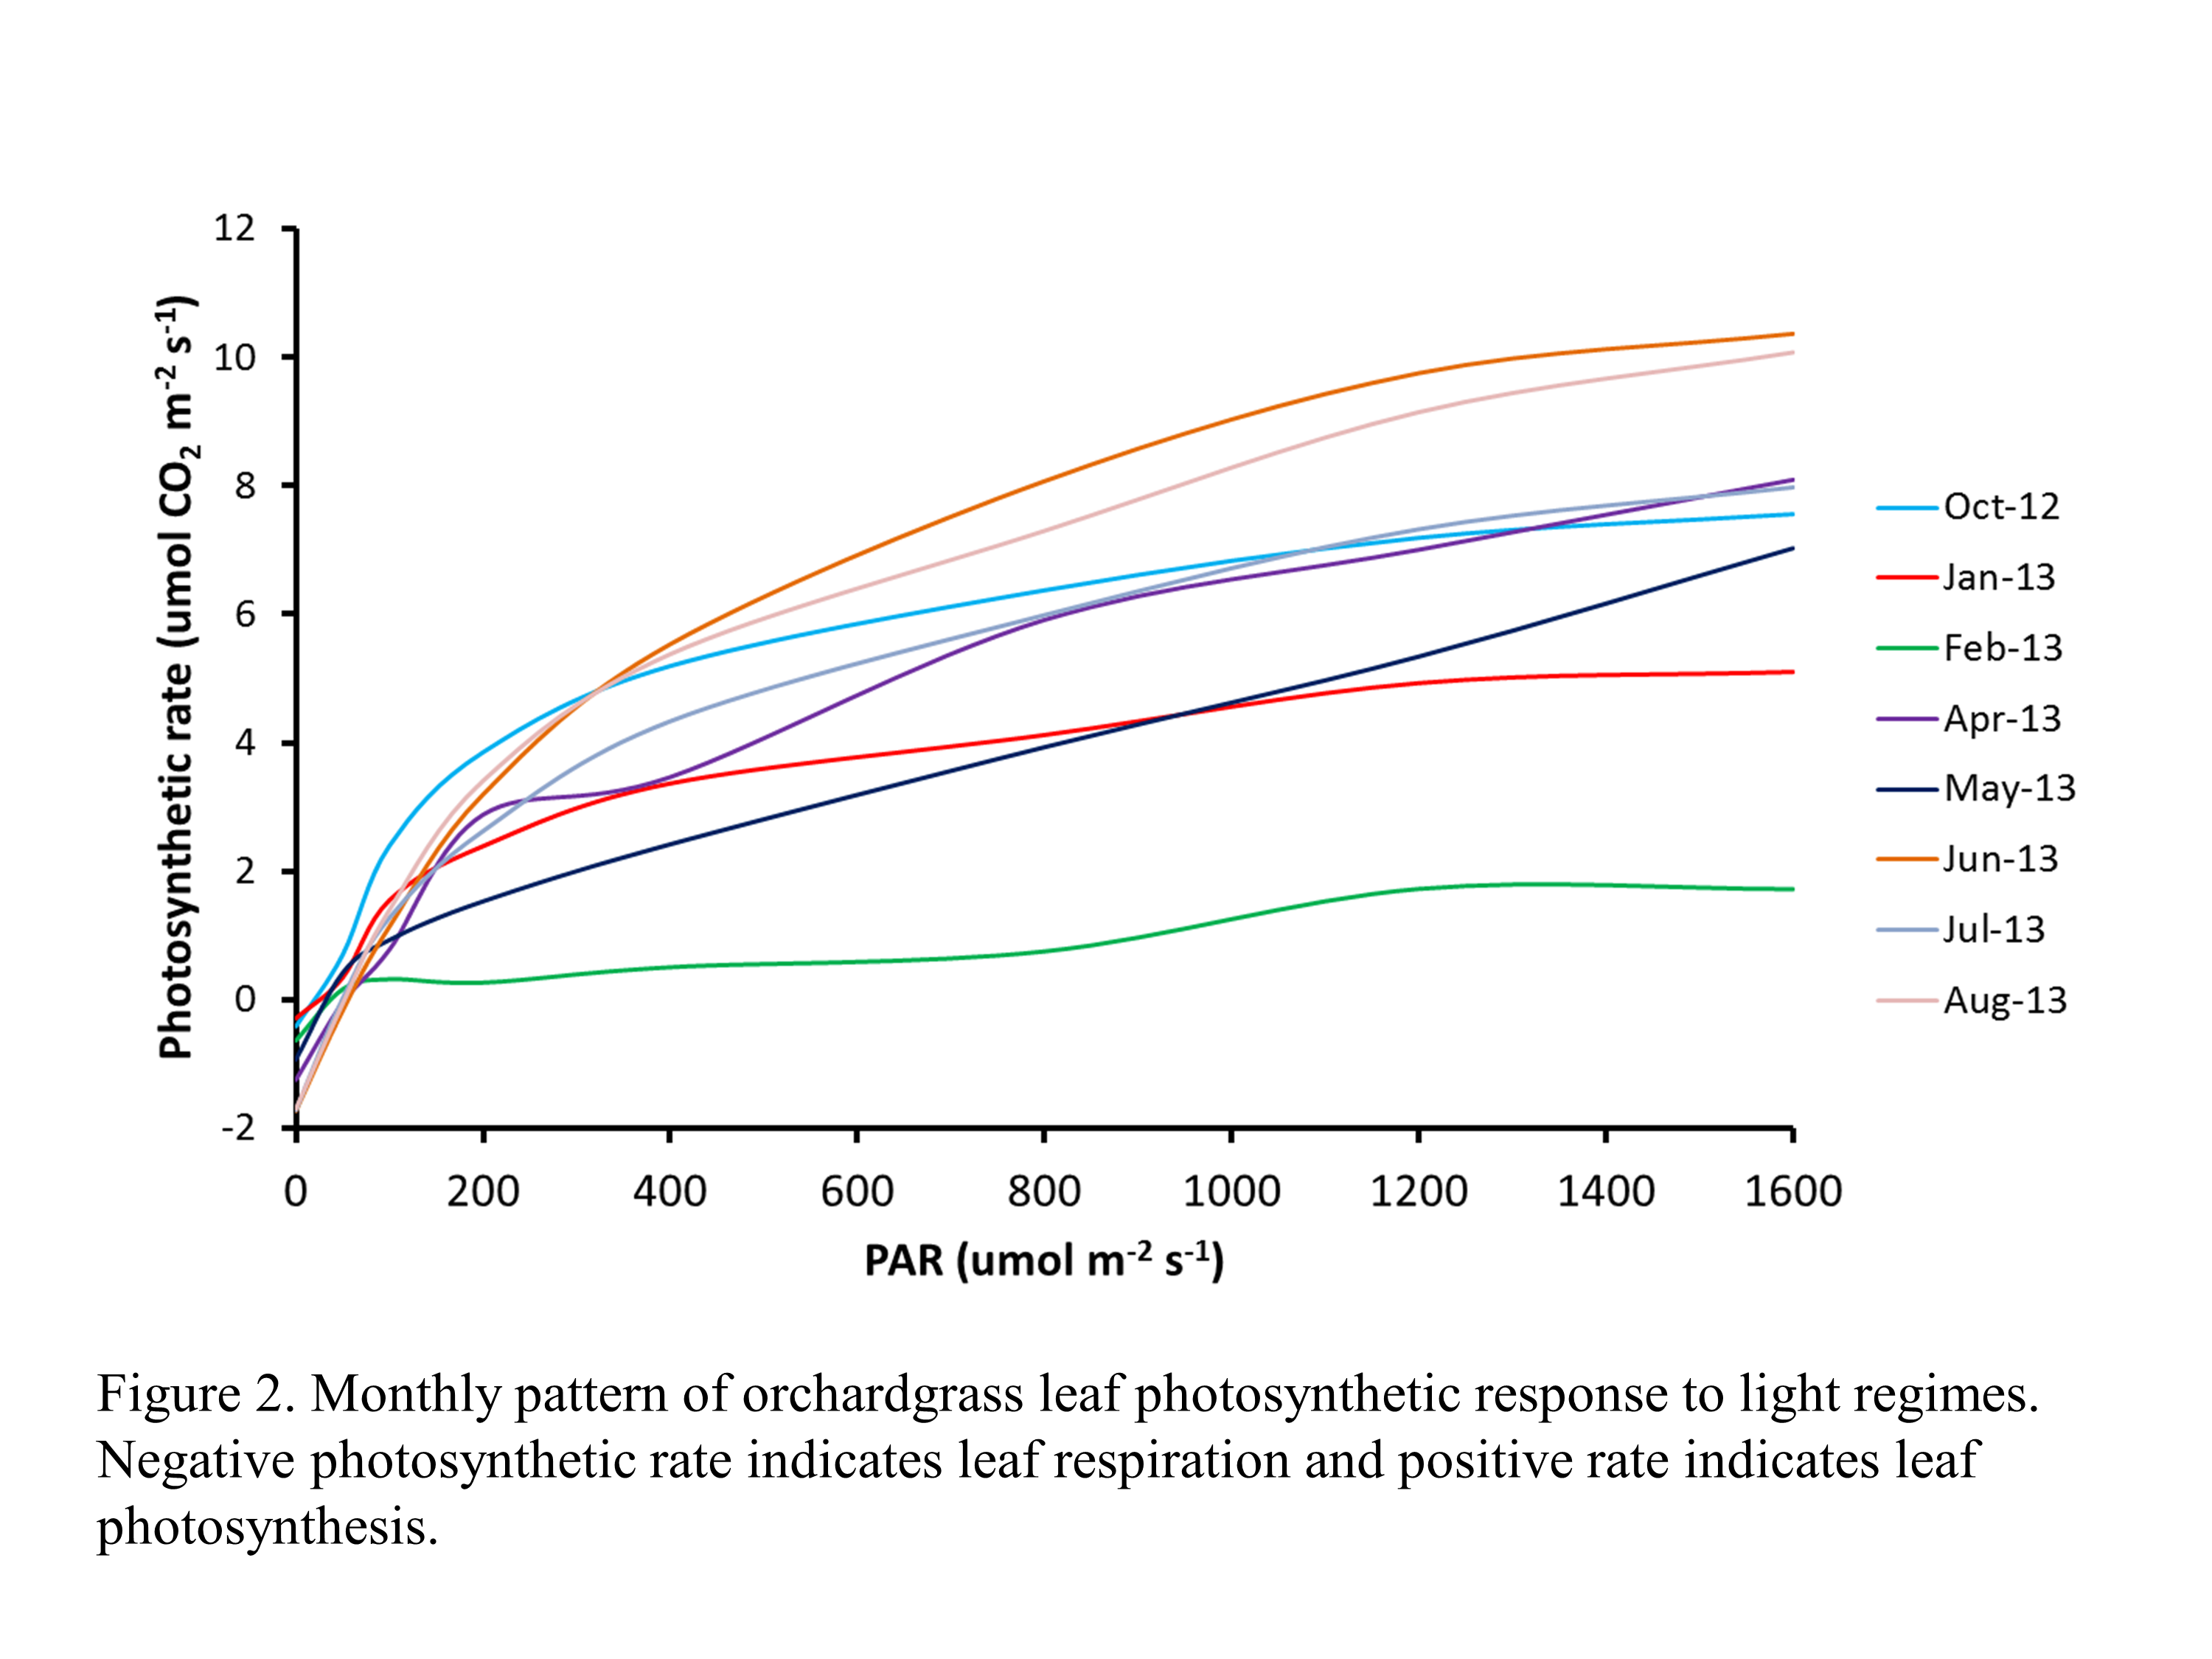
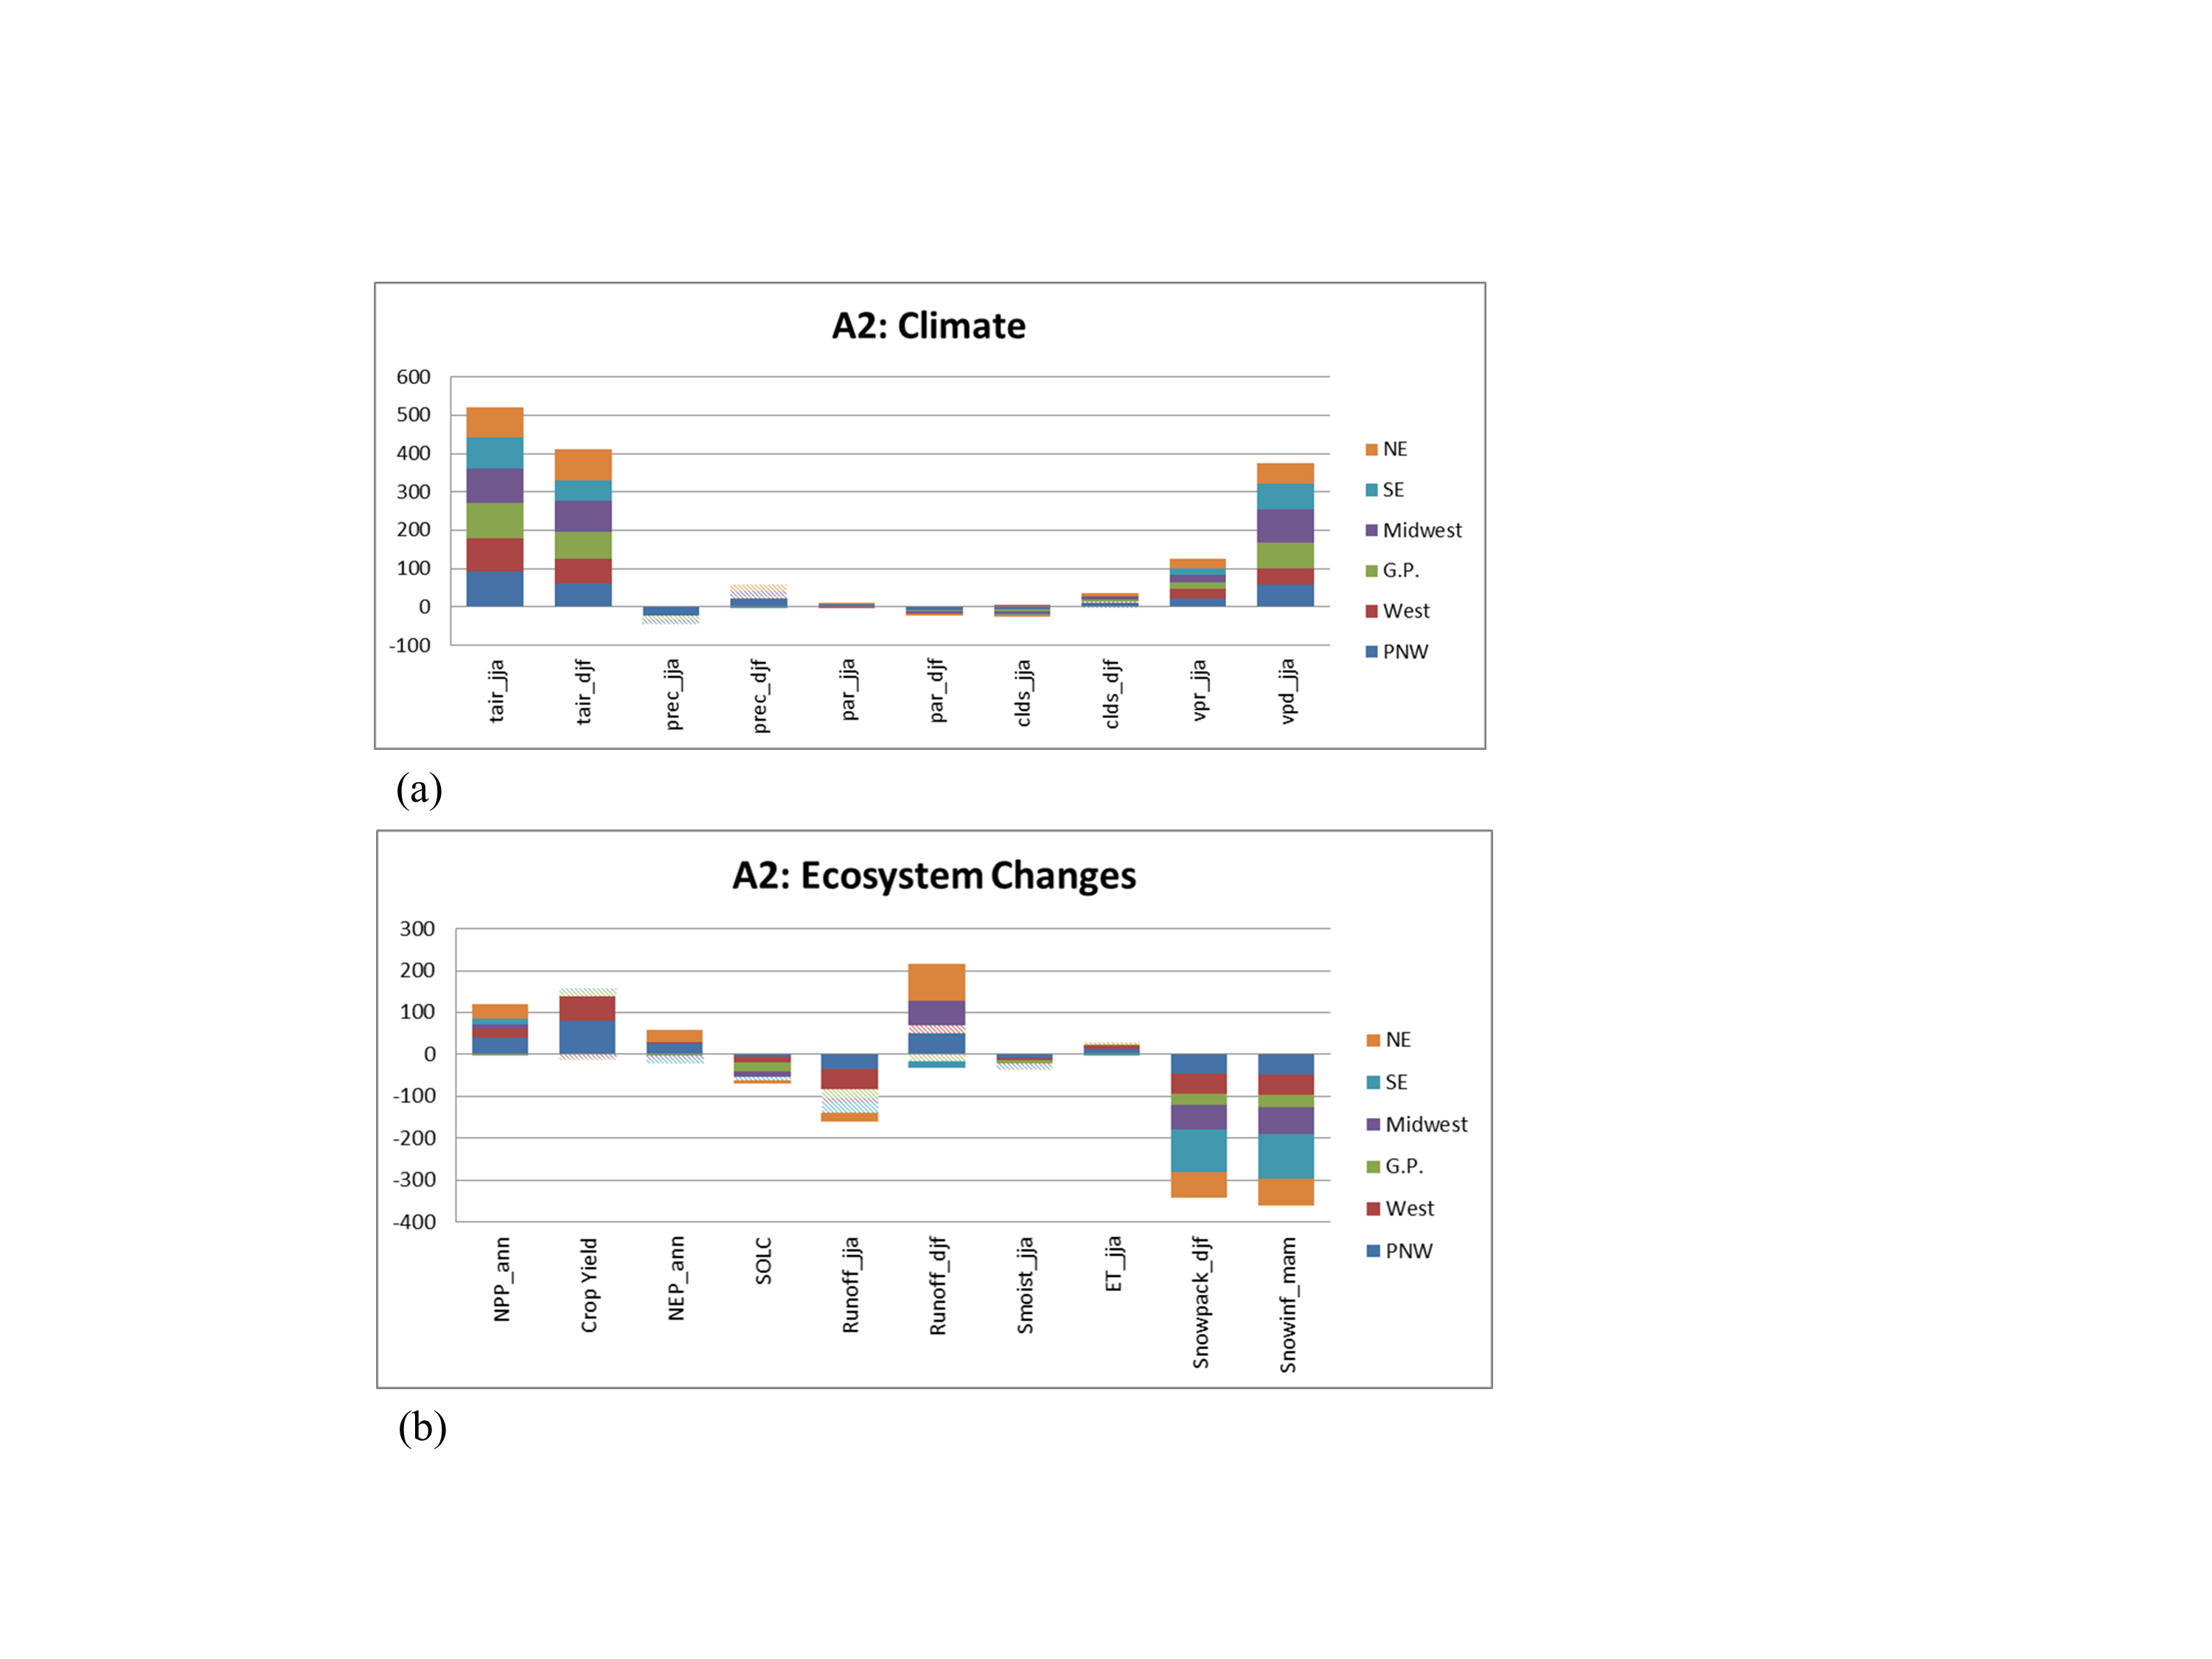
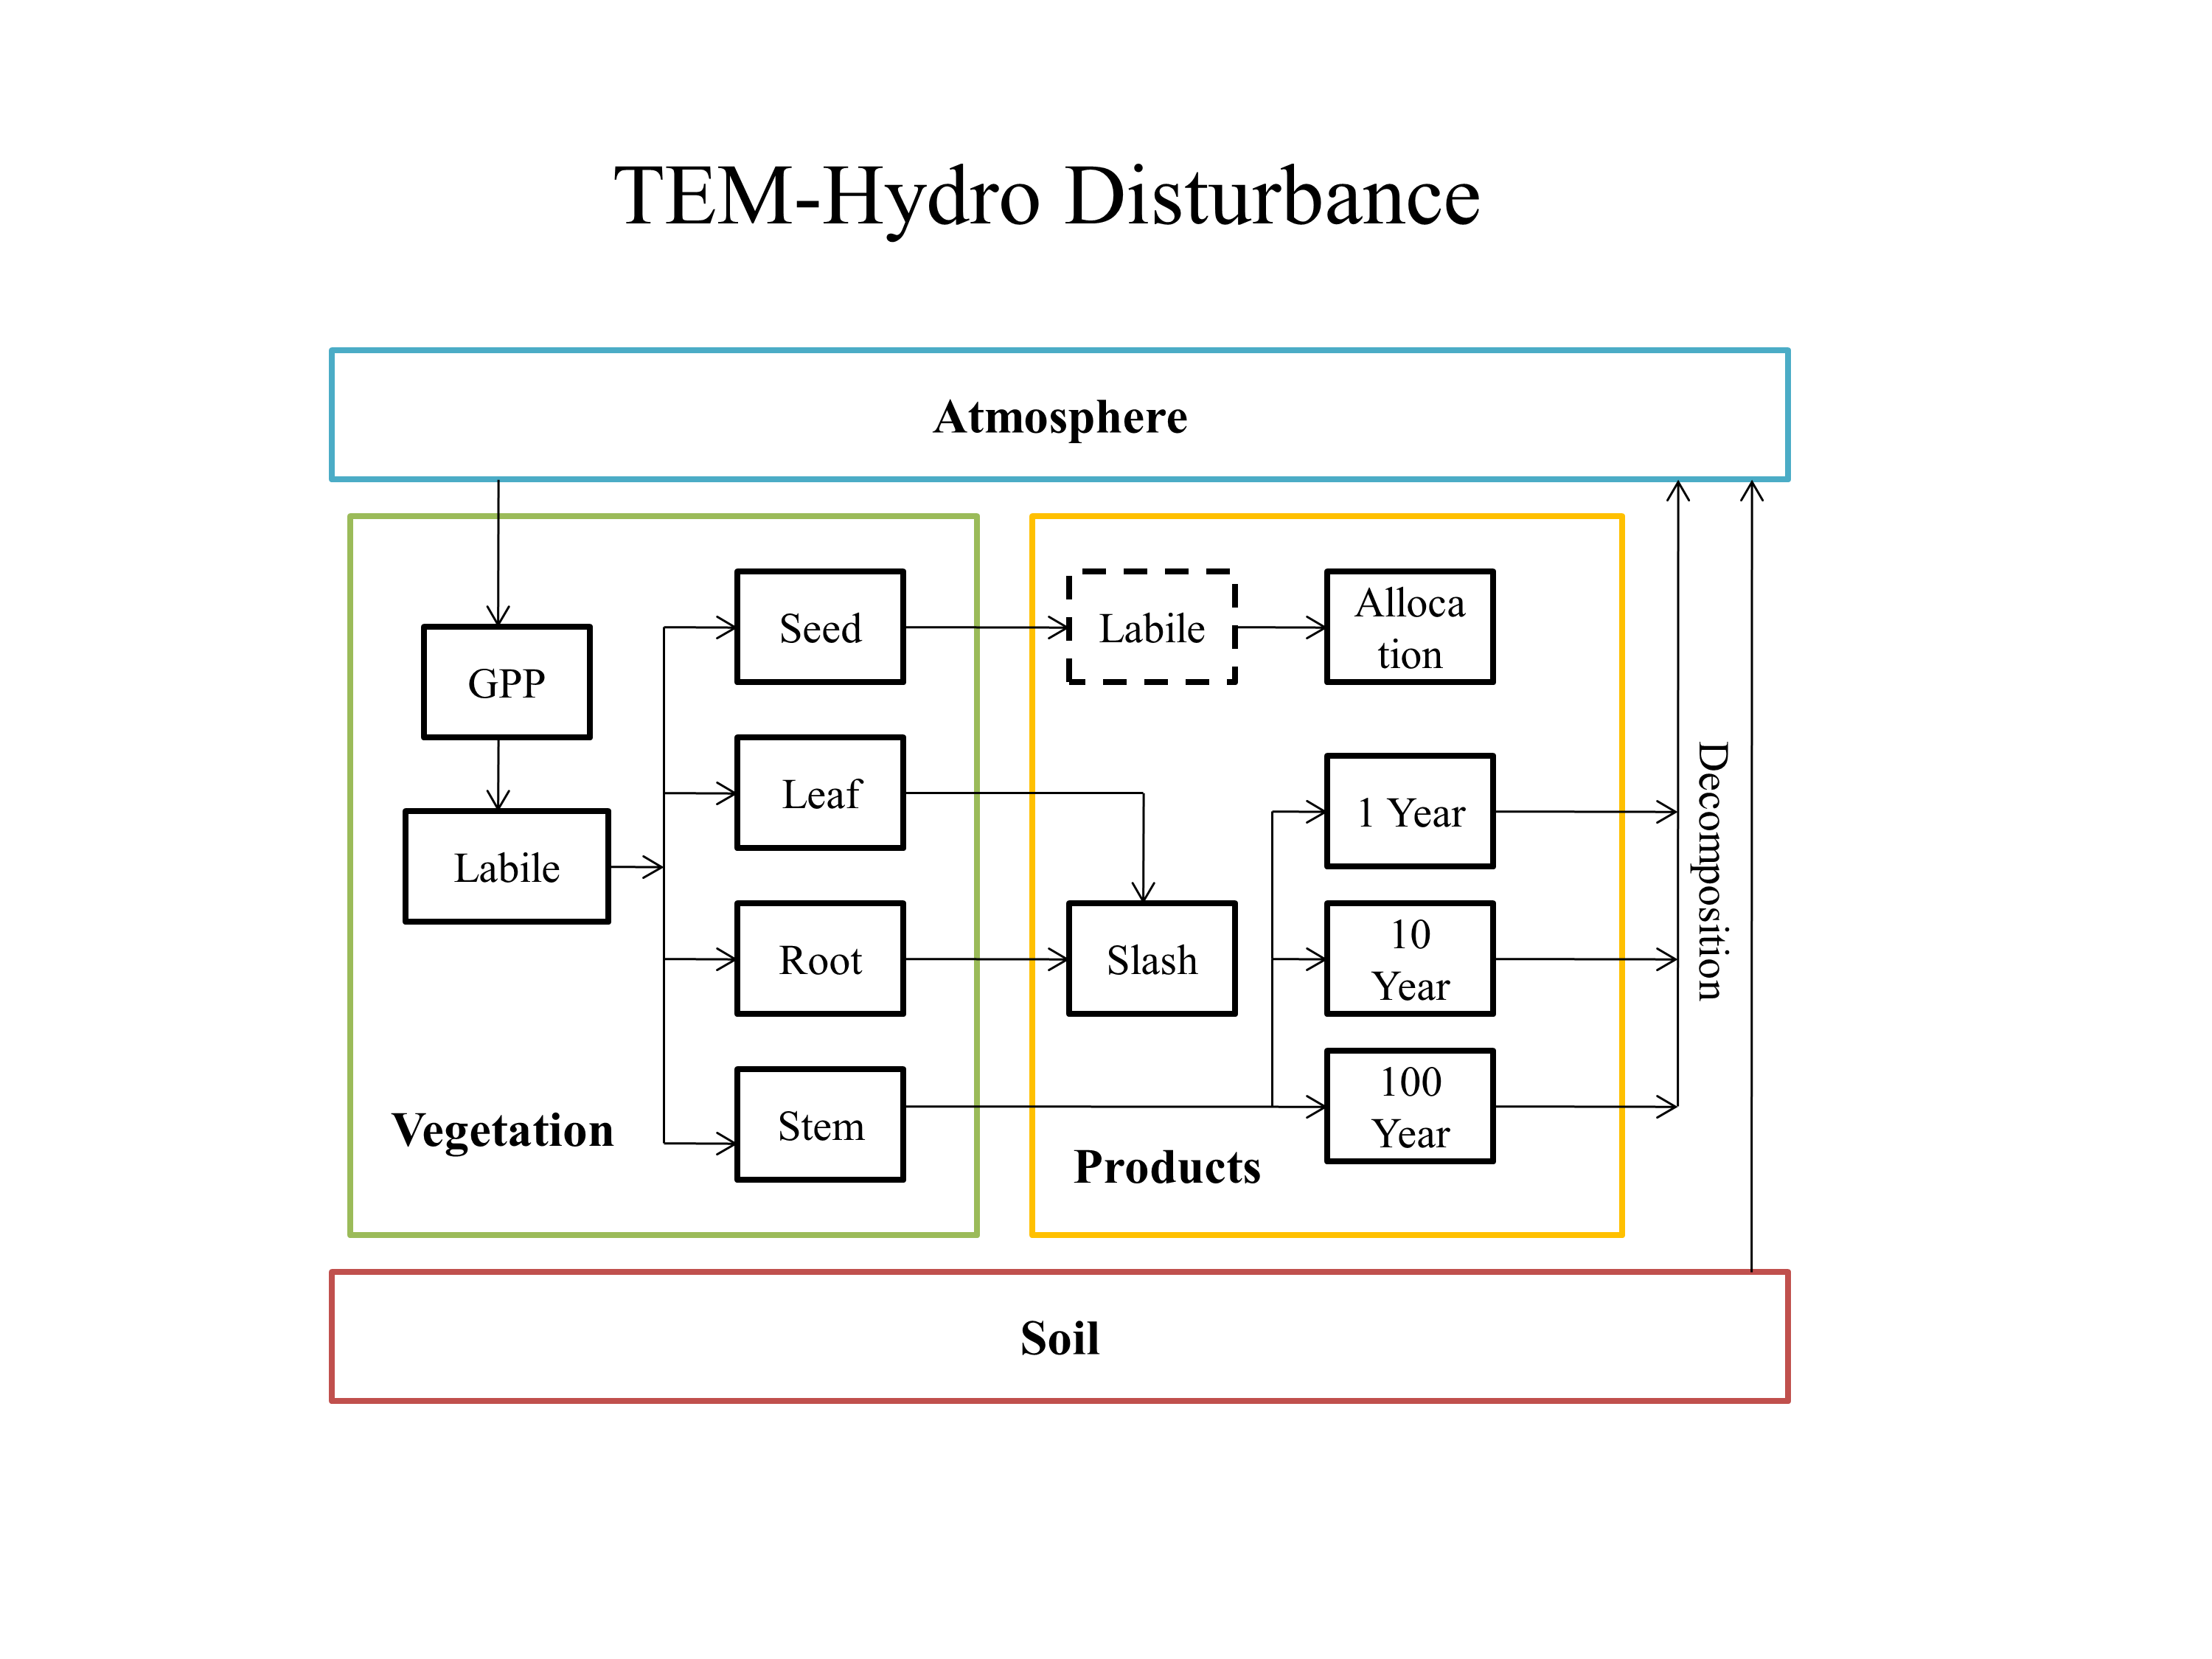
To explore how services provided to humans by ecosystems are affected by climate change, I developed high resolution climate datasets (1/8o) for the entire U.S. from 14 different climate models (CMIP3) and 3 different future scenarios (A2, B1, A1B) to run through TEM-Hydro for an intermodel comparison (Felzer and Sahagian, 2013) that should be of interest to a broad spectrum of stakeholders. In this study we determined the level of model agreement and trend significance for different regions of the U.S., for both the climate model output (which is input to TEM-Hydro), and the output from the TEM-Hydro. I have also explored the role of land use change in Pennsylvania on environmental resources and ecosystem services (Felzer et al., 2012), including the availability and quality of water, flooding, forest and crop productivity. This most recent version of TEM-Hydro allows nitrogen input from the atmosphere as well as nitrogen leaching from the soils, and accounts for disturbance effects from changing land use. To improve our representation of dairy farms, my two Ph.D. students, Mingkai Jiang and Jien Zhang, collected carbon flux data (photosynthesis and respiration) from the Rodale dairy farm using LI-COR equipment and carbon and nitrogen concentrations in the grass and soil from core samples (with the help of undergraduates David Kolvek and Trista Barthol). Currently, modeling of dairy farms is based on carbon and nitrogen values from Konza prairie in Kansas which, unlike PA, is very dry and dominated by C4 grasses. The new calibration shows that future productivity in Pennsylvania dairy farms is more sensitive to warming and elevated CO2 than the original calibration. (Jiang et al., in review, Crop Science).
U.S. Study
Felzer, B. and Sahagian, D. Climate impacts on regional ecosystem services in the United States from CMIP3-based multimodel comparisons. Climate Research. doi0.3354/cr01249. in press.
 ,
,